
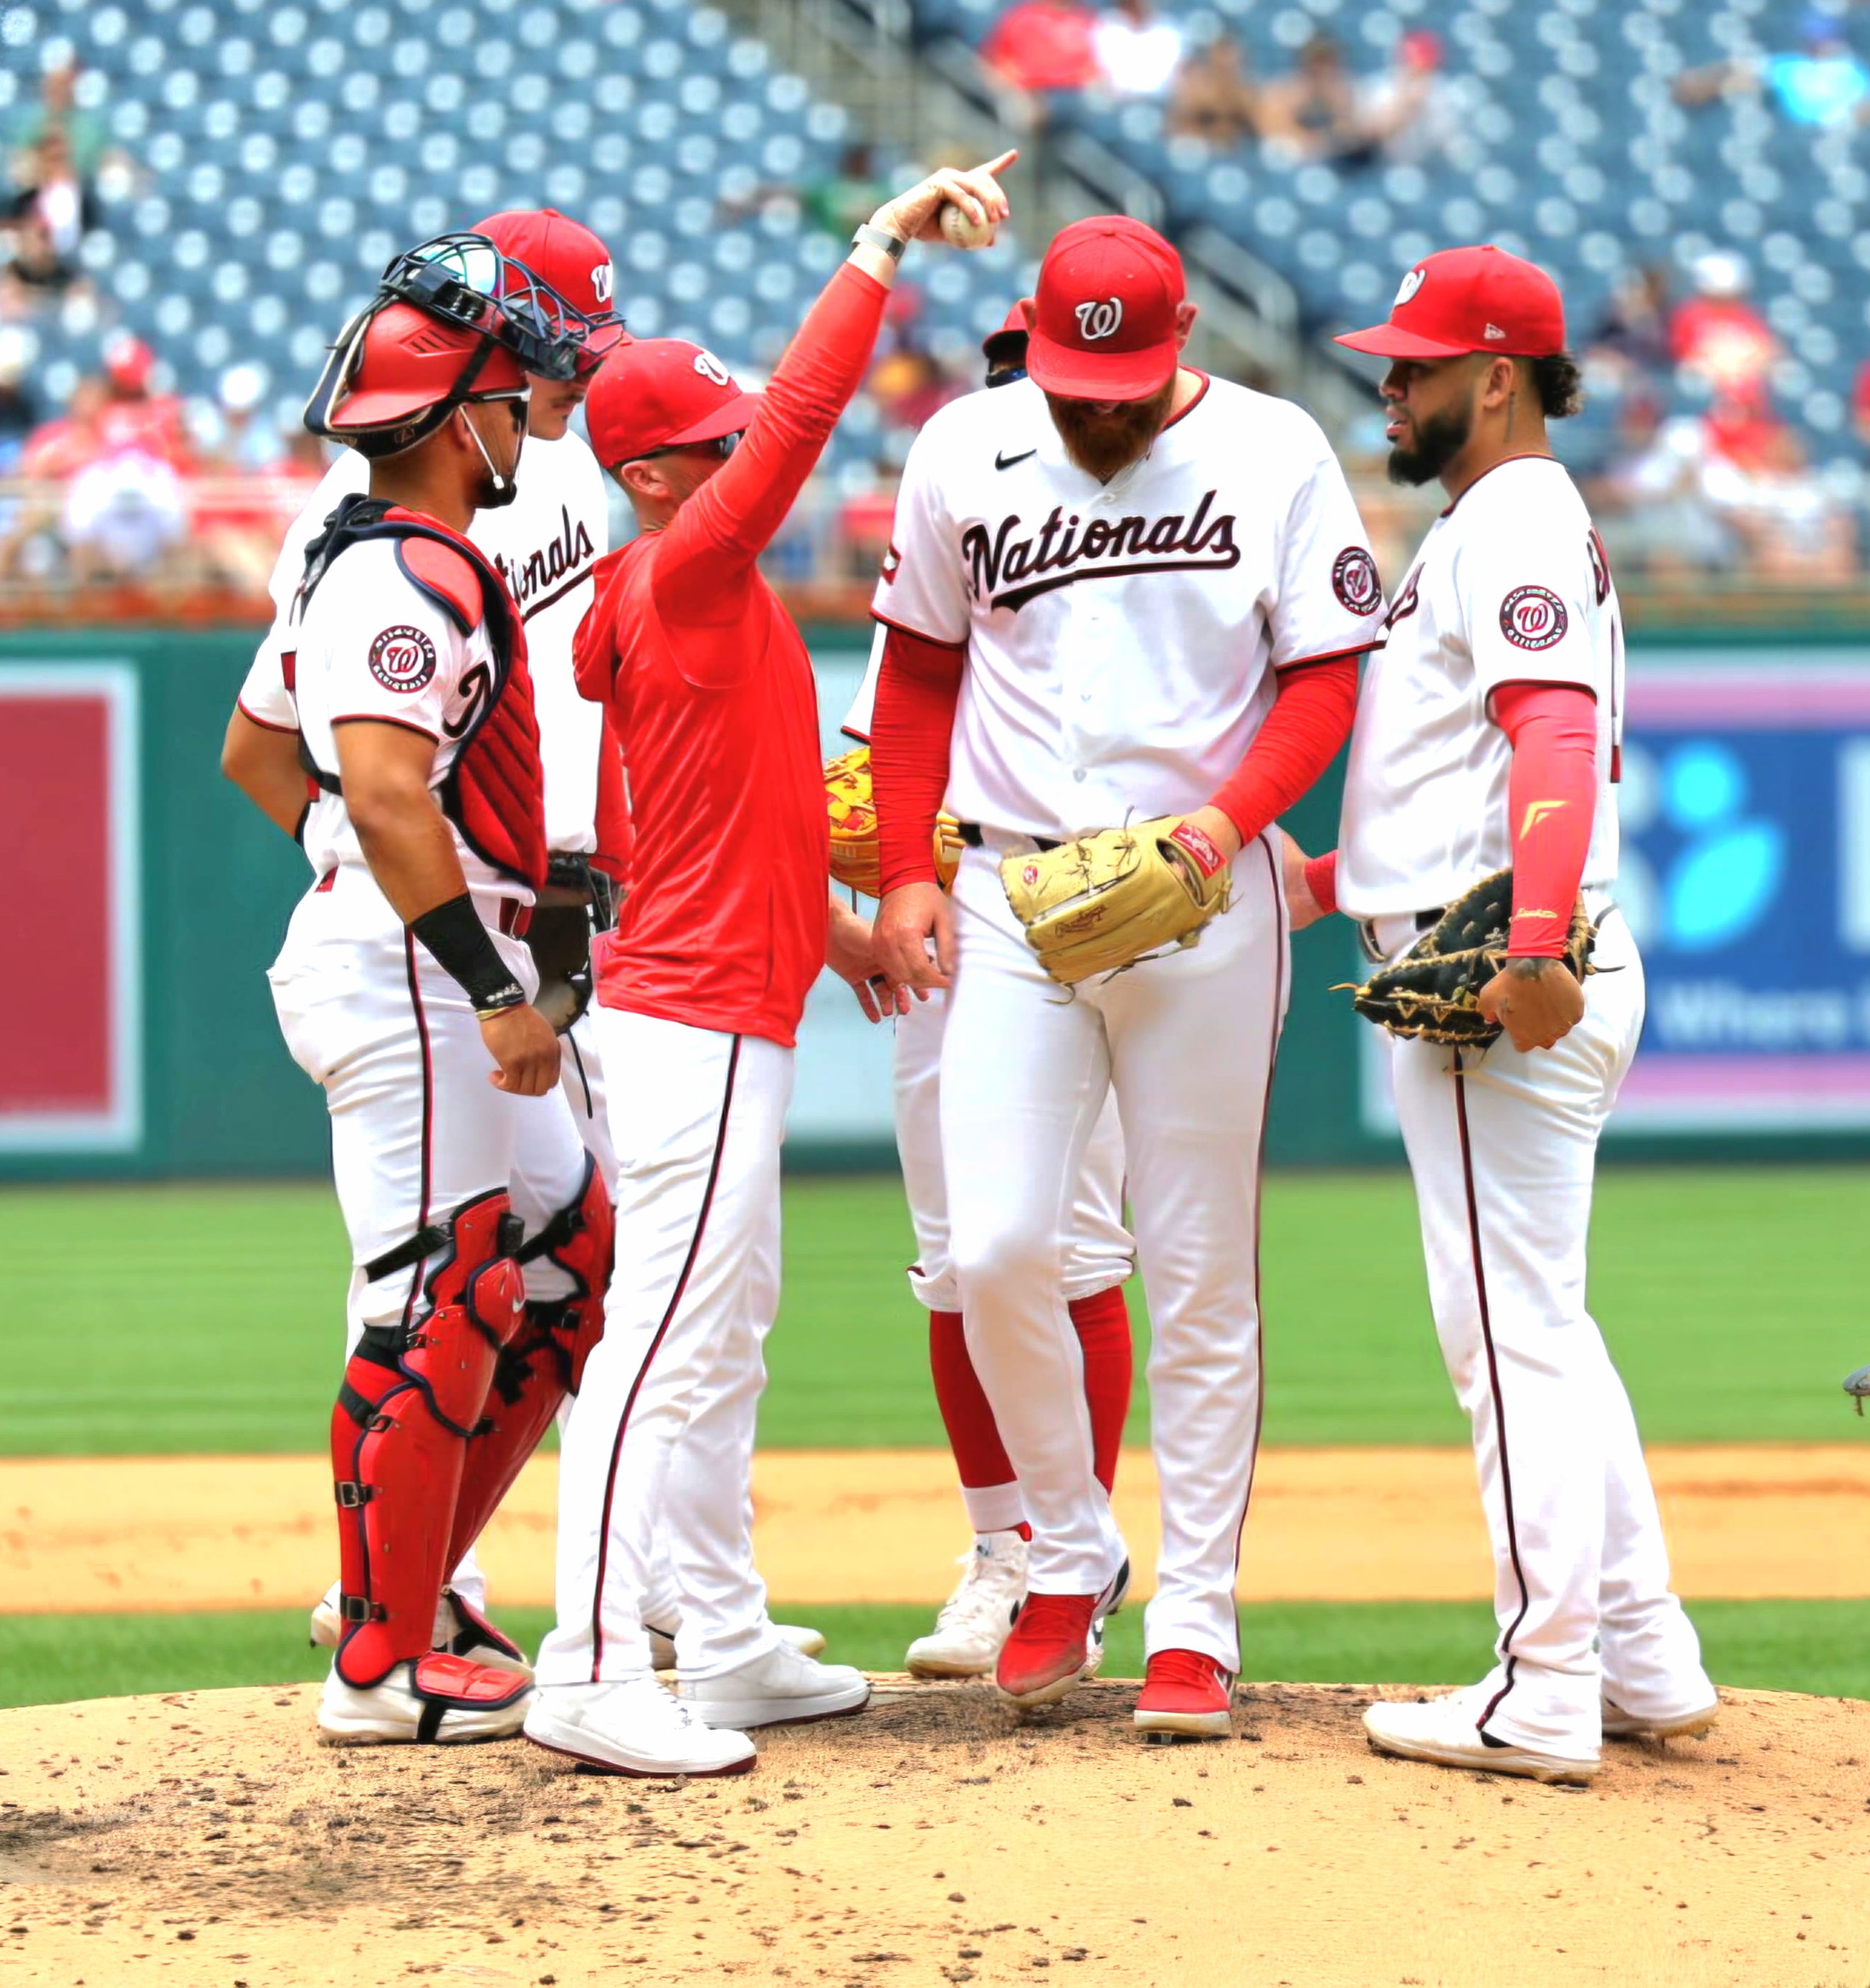
Not all blown saves are created equally. The blown save rules are complex, and sometimes not fair. Of the 37 blown saves the Washington Nationals have had in the 2026 season, there have been 22 games lost of the team’s 79 total losses. That translates to 27.8 percent of the losses have come from blown saves. And yes, the Nats have won 11 games in which they had blown saves. If you think the numbers are off because they don’t add up to 37, that is because there were four games that the team had two blown saves recorded.
The Nats have had 71 games with save opportunities. That is a lot of games so the team isn’t the worst in blown save percentages. They are third to last. But contrast the Nats with the Tampa Bay Rays who have had 72 save opportunities and only have blown 17 games and not all of those were losses.
Of the Nats 22 blown saves that turned into losses, there were 15 that were blown-save-losses. That means the pitcher with the blown save also took the loss. If you are going to have a blown save, at least keep the game tied, right?!?
The team leader in blown saves is Clayton Beeter (7) followed by Mitchell Parker (5), Tom Cosgrove (3), Richard Lovelady (3), Orlando Ribalta (3), Yovanny Cruz (2), Cole Henry (2), Brad Lord (2), PJ Poulin (2), Gus Varland (2), Riley Cornelio (1), Will Dion (1), Max Kranick (1), Matt Krook (1), Paxton Schultz (1), and Ken Waldichuk (1). That is a not so sweet-16 of relievers who made that list. What might be most impressive is that Cionel Perez entered in six save situations and did not have a blown save but was DFA’d on May 4 with a 6.19 ERA.
A blown save can occur when a relief pitcher enters a game with a lead of three runs or less, and the opposing team either ties the score or takes the lead against that reliever — but there is a lot of subjectivity in establishing the prior pitcher of record when a starter pitches less than 5.0 full innings.
Core Rules and Criteria
- Save Situation Requirement: The pitcher must enter under official save conditions, such as holding a lead of three runs or less, entering with the tying run on base, at bat, or on deck, or slated to pitch the final three innings.
- Timing: Blown saves are not restricted to the ninth inning; they can happen in any inning if a reliever gives up the lead once the official scorer has established a previous pitch had the lead and would have given that pitcher a win if the lead was retained for the remainder of the game. That leaves some subjectivity for the official scorer where we could not find an instance of a blown save assessed before the sixth inning of a game.
- Inherited Runners: A pitcher is charged with a blown save if they let an inherited runner score that ties the game, even if that runner was put on base by a different pitcher.
- Post-Blown Save Status: Once a pitcher blows a save, they cannot earn a save later in that game, though they can still earn a win or loss depending on the final outcome.
For reference, the Screwball website has done a great job of keeping track of blown saves. I just wish they tracked the blown saves that turn into losses. It would be nice to have a baseline to see how many more games the Nats should have won if they just had a league average bullpen.
Here is a chart I assembled with a h/t to Intrepid who sent me an email to discuss this further.

Hopefully this helps with the understanding of the blown saves and the overall impact on this 2026 team. There are some interesting patterns like 3-of-the-6 games against the Dodgers had blown saves. By the way, the Nats had leads in 4-of-the-6 games against the Dodgers. Possibly more disturbing are the six blown saves against the Phillies. On top of that, the Nats blew saves in 2-of-the-3 games with the New York Yankees.
For the Washington Nationals, they have had some horrible bullpens over the years. Don’t let anyone try to tell you that this is a new problem. If you take the Rockies out of the equation, the Nats bullpens measured by ERA have been the worst in MLB for the 10 years of 2015-to-2025. We aren’t even including 2026 in those numbers. By the way, that 2021 Nats’ team had 36 blown saves. And there were some very expensive bullpens that the Nats assembled in those 10 years — and they still were putrid most of the time.
We have brought this up before, and this is not the worst bullpen ERA of Nats teams. Not even close to the worst. The 2019 World Series team had a ERA that was 5.68. That is not a misprint. The 2026 bullpen ERA is currently 5.06 . Yes, that is poor also.
Fans want money thrown at building a new bullpen. How did that work for the prior front office? They tried that many times. Remember what they spent on Trevor Rosenthal to be part of that 2019 team? It took extreme creativity in that 2019 World Series season to create what was essentially a 2-man “A” bullpen of Sean Doolittle and Daniel Hudson with a “B+” bullpen of Fernando Rodney and Wander Suero. The rest were “B-” and “F” bullpen arms.
President of Baseball Operations, Paul Toboni, has really beefed up the minor league bullpen system through the draft, trades, and undrafted free agents. It took Toboni a while to figure it out that the Nats’ relievers in the minor leagues was very light.
Toboni, who had been with the Red Sox organization for nearly a decade, has seen how great bullpens are built. This season, Boston’s bullpen is first in best WHIP and second in ERA and fourth in save percentage. And the Red Sox have only lost eight games after a blown save this season. Just imagine if the Nats had, say, 10 fewer blow saves that turned into losses, and had two better starters. That’s a postseason team. Hope for the future.
It has just been tough to fix this current bullpen for Toboni as the team really needed one shutdown closer. At some point, players have to execute, but the coaches shouldn’t walk away unscathed from the failures.
We have talked about who might be part of the bullpen for next year. With the current injury to Orlando Ribalta, who knows. So much is up in the air. We wrote about the future bullpen in an article last week.
Who would be a lock for the 2027 Nats’ bullpen? We can tell you in small sample sizes as to who has looked good:
- Orlando Ribalta RHP 3.77 ERA
- Erik Tolman LHP 1.23 ERA
- Will Dion LHP 3.20 ERA
- Jared Simpson LHP 0.00 ERA
- Brad Lord RHP 3.62 ERA
- TBD
- TBD
- TBD
Some names not on that list from the current bullpen are Clayton Beeter RHP, Yovanny Cruz RHP, Riley Cornelio RHP, Luis Perales RHP, PJ Poulin LHP (currently on the IL), Jack Sinclair RHP, and Matt Waldron RHP. You might say that Waldron looks the best of that group. He has a 0.00 ERA in 3-games with the Nats this season. Waldron is team controlled through the 2030 season.
Minor leaguers who are not on that list include Jake Bird, Joe Glassey, Ben Grable, Cole Henry, Zak Kent, Wyatt Mills, Kyle Nicolas, Carson Palmquist , Paxton Schultz, Gus Varland, and Eddy Yean. All of them are on the 40-man roster except for Glassey and Grable. And there are others too.
Last week, manager Blake Butera made it clear in another blown-save-loss that he can only pitch the players he has. ❝… My job is to do the best job I possibly can with the team we have — and the bullpen we currently have. … We can’t keep giving up these leads.❞ Nothing has changed from that quote. They keep giving up these leads.
The Nats lead all of baseball in blown saves (37), bullpen home runs (100), and bullpen walks (296). The Nats are second to last in bullpen K% at 18.9 percent. These are all inter-related issues leading to the failures of this bullpen.
Maybe after you look at all of this you will feel the numbers aren’t all that bad. No, they are bad, but the blown save percentage isn’t the worst in baseball. Again, things could always be worse.











Leave a Reply